Typhoon Tip’s 870 hPa in 1979 is the lowest central pressure ever recorded in a tropical cyclone. These are 17 hurricanes, typhoons and cyclones from every ocean basin, ranked by lowest estimated central pressure, as of October 23, 2026.
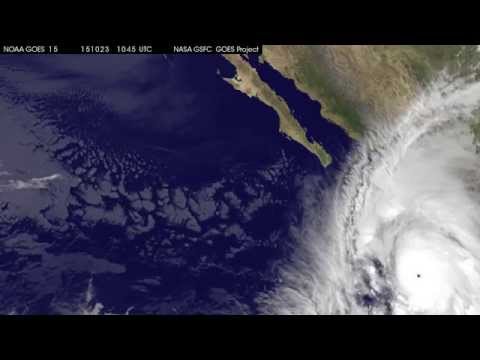
Pictured: a still from NASA’s “Satellite Movie Sees Record-Breaking Hurricane Patricia”, for Hurricane Patricia, #2 with an 872 hPa lowest pressure. Typhoon Tip, #1, has no video from an authoritative channel here.
Rank
Storm
Year
Lowest pressure (hPa)
Peak winds, 1-min (km/h)
Basin
Pressure source
Landfall / impact
1
Typhoon Tip
1979
870
305
West Pacific
Measured by aircraft reconnaissance
Landfall on Honshu, Japan, Oct 19; 99 deaths; largest cyclone on record (2,220 km wide)
2
Hurricane Patricia
2015
872
345
East Pacific
Estimated (NHC analysis after aircraft data)
Landfall in Jalisco, Mexico, as a Category 4 (932 hPa); 13 deaths; strongest winds on record
3
Typhoon June
1975
875
295
West Pacific
Dropsonde 876, best track 875
Stayed offshore, passing Guam and Yap; no deaths
3
Typhoon Nora
1973
875
295
West Pacific
Dropsonde 877, best track 875
Luzon, then landfall near Xiamen, China; about 40 deaths
5
Typhoon Ida
1958
877
325
West Pacific
Measured by dropsonde
Landfall on Honshu, Japan, Sep 26; 1,269 deaths
6
Typhoon Kit
1966
880
315
West Pacific
Estimated (JMA); lowest observed 912
Passed near Japan; 64 deaths, 19 missing; Tokyo subway flooded
6
Typhoon Rita
1978
880
280
West Pacific
Estimated (JMA); JTWC 878
Struck Luzon, Philippines; at least 444 deaths, 354 missing
6
Typhoon Vanessa
1984
880
285
West Pacific
Estimated (JMA); JTWC 879
Stayed offshore; outer-band flooding killed 63 in the Philippines
9
Hurricane Wilma
2005
882
295
Atlantic
Estimated (dropsonde read 884)
Cozumel, Yucatan, then south Florida; 52 deaths; US$26.5 billion damage
10
Typhoon Allyn
1949
884
—
West Pacific
Single-source figure (pre-1951)
Passed within 35 miles of Guam on Nov 17; no deaths, hundreds of homes destroyed
10
Cyclone Winston
2016
884
285
South Pacific
Estimated (Fiji Met Service, satellite-based)
Landfall on Viti Levu, Fiji, Feb 20; 44 deaths; US$1.4 billion damage
12
Typhoon Forrest
1983
885
280
West Pacific
Estimated (JMA); aircraft extrapolated 876
Passed near Guam; 21 deaths, 17 missing; fastest deepening on record
12
Typhoon Megi
2010
885
295
West Pacific
Estimated (JMA); aircraft measured 890
Landfall on Luzon at peak, then Fujian, China; 69 deaths
12
Typhoon Nina
1953
885
—
West Pacific
Best-track estimate (1953)
Landfall in China as a Category 4, then Japan as an extratropical storm
12
Typhoon Joan
1959
885
315
West Pacific
Estimated (JMA); JTWC 891
Landfall in Taiwan, then Fujian, China; 41 deaths
12
Typhoon Irma
1971
885
290
West Pacific
Best-track estimate (1971)
Stayed at sea; minor damage; deepened 96 hPa in 24 hours
17
Typhoon Marge
1951
886
185
West Pacific
Best-track estimate (1951)
Landfall near Boryeong, South Korea; 12 deaths; largest cyclone until Tip
No matching rows.
As of October 23, 2026; the typhoon and hurricane seasons are still running. Storms are ranked by lowest estimated central pressure in hectopascals (hPa, the same unit as millibars); a lower number is a stronger storm, tied storms share a rank, and each storm is counted once, at its lowest value. The list follows Wikipedia’s List of the most intense tropical cyclones and each storm’s own article, and every row was checked against an agency source: the Japan Meteorological Agency’s best-track file (all West Pacific rows from 1951 on), the National Hurricane Center’s reports (Patricia, Wilma), NASA and Guinness World Records.[1][2][3][4]The pressures are not all measured the same way. The table marks a storm “Aircraft-measured” where a reconnaissance aircraft read the pressure (Tip) or dropped a sonde that read within about 1–2 hPa of the figure used (June, Nora, Ida); every other row is an agency estimate, from satellite images or from aircraft data that missed the centre, and the column says what the aircraft saw where that differs. US aircraft stopped flying into West Pacific typhoons in August 1987, so Tip’s record is the last of its kind, and satellite estimates for storms such as Haiyan (2013) have been put as low as 858 hPa without being accepted as records.[5] Pre-1951 data (Allyn) is outside the JMA file and rests on a single listed figure. Winds are the 1-minute sustained peak from the US Joint Typhoon Warning Center (West Pacific), the National Hurricane Center (Patricia, Wilma) and JTWC for Winston, in km/h; the JMA’s 10-minute winds run roughly 10–15% lower (Tip: 260 km/h), and pre-1970s wind estimates, such as Kit’s 315 km/h, are considered overestimates. A dash means no 1-minute figure was found. Where sources disagree: Wikipedia lists Typhoon Nancy (1961) at 882 hPa, but the JMA best track gives 890 hPa, so Nancy is left out; Gilbert (888, Atlantic, ranked in The Strongest Atlantic Hurricanes on Record), an unnamed 1927 typhoon (887) and the 890 hPa group fall just below the cut, which stops at 886 hPa after the 885 hPa tie. The Indian Ocean and Australian region do not reach the table: their lowest values are Gafilo (895, 2004) and Gwenda and Inigo (900). 2026 season: no 2026 storm is in the table. Super Typhoon Champi was at 900 hPa on October 21 by JMA, with JTWC winds near 296 km/h, and Sinlaku (905), Bavi (910) and Hurricane Polo (892 hPa by the National Hurricane Center, second-lowest of the East Pacific) all fall outside it.[6] Pressures are revised as old records are reanalysed. For the Atlantic alone, see The Strongest Atlantic Hurricanes on Record.
The Top 10
#1
Typhoon Tip — 870 hPa
Tip holds the record for the lowest central pressure ever observed in a tropical cyclone: 870 hPa, read by a US Air Force reconnaissance aircraft on October 12, 1979, about 840 km west-northwest of Guam, with 1-minute winds of 305 km/h (the JMA gives 260 km/h over 10 minutes). It was also the largest tropical cyclone on record, with gale-force winds reaching 2,220 km across. Tip made landfall on Honshu, Japan, on October 19 and killed 99 people, including 13 US Marines in a fire at Camp Fuji that followed the storm’s heavy rain. About 60 reconnaissance flights tracked it, which is why its pressure is better documented than most.[1][2][5] No suitable video from an authoritative channel was found, so the icon is shown instead.
#2
Hurricane Patricia — 872 hPa
Patricia is the lowest on record outside the West Pacific, and the only storm with 1-minute winds of 345 km/h, the highest ever estimated. Its central pressure fell about 95 hPa in a day on October 22–23, 2015, off Mexico. The 872 hPa is the National Hurricane Center’s analysis, set after a Hurricane Hunter mission six hours earlier; the dropsonde reading nearer the time was 894 hPa, which NHC judged too high because it missed the centre.[3] It weakened sharply before striking Jalisco as a Category 4 (932 hPa), and 13 deaths were reported. The video is NASA’s satellite movie of the storm.
#3 (tie)
Typhoon June — 875 hPa
June deepened by about 90 hPa in 24 hours before an aircraft dropsonde read 876 hPa on November 19, 1975, near the eye, a few hours before the best track’s 875 hPa. Later studies noted that the sonde missed the exact centre, so the true minimum may have been lower. June held the record until Tip, never made landfall, and passed near Guam and Yap with US$1.3 million in damage and no deaths.[1][2] No suitable video from an authoritative channel was found, so the icon is shown instead.
#3 (tie)
Typhoon Nora — 875 hPa
Nora’s central pressure fell 77 hPa in 24 hours to an aircraft dropsonde reading of 877 hPa on October 6, 1973, inside the eyewall; the JMA best track gives 875 hPa, with winds estimated at 295 km/h. Post-storm analysis said the true minimum was probably a little lower. It crossed northern Luzon (24 deaths in the Philippines), passed south of Taiwan and made landfall near Xiamen, China, on October 10, for about 40 deaths overall.[1][2] No suitable video from an authoritative channel was found, so the icon is shown instead.
#5
Typhoon Ida — 877 hPa
Ida set the world record in 1958: a reconnaissance aircraft dropped a sonde into the eye on September 24 and read 877 hPa, 10 hPa below the previous record from a 1927 typhoon. It stood until June in 1975. After weakening it struck Honshu, Japan, on September 26 as the Kanogawa Typhoon, which killed 1,269 people and did US$50 million in damage, making it one of the deadliest typhoons in Japanese history.[1][2] No suitable video from an authoritative channel was found, so the icon is shown instead.
#6 (tie)
Typhoon Kit — 880 hPa
Kit’s 880 hPa is a JMA estimate from June 26, 1966, after it deepened 51 hPa in 18 hours; the lowest pressure an aircraft actually observed was 912 hPa, so this row is among the least certain. The JTWC’s 315 km/h winds are probably an overestimate. Kit passed near Japan, where flooding stranded about 2 million people when Tokyo’s subway shut; 64 people died and 19 were missing.[1][2] No suitable video from an authoritative channel was found, so the icon is shown instead.
#6 (tie)
Typhoon Rita — 880 hPa
Rita (Kading in the Philippines) reached 880 hPa by the JMA best track on October 25, 1978, about 1,050 km east of Manila, though the JTWC put it at 878 hPa and the lowest aircraft report, a day earlier, was 888 hPa. It struck Luzon overnight on October 26, leaving 200,000 homeless; at least 444 people died and 354 were missing.[1][2] No suitable video from an authoritative channel was found, so the icon is shown instead.
#6 (tie)
Typhoon Vanessa — 880 hPa
Vanessa deepened 100 hPa in 48 hours in October 1984 and peaked at 880 hPa by JMA (879 hPa by JTWC) with 1-minute winds of 285 km/h, west of the Philippines. It never made landfall there, but outer rain bands brought flooding that killed 63 people.[1][2] No suitable video from an authoritative channel was found, so the icon is shown instead.
#9
Hurricane Wilma — 882 hPa
Wilma is the Atlantic record: 882 hPa on October 19, 2005, an NHC estimate, since the lowest dropsonde reading was 884 hPa and the NHC concluded it missed the centre. Its pressure fell about 100 hPa in 30 hours and winds reached 295 km/h. It hit Cozumel and the Yucatan, then crossed south Florida near Cape Romano as a Category 3 on October 24; 52 people died and damage totalled US$26.5 billion. The video is The Weather Network’s look at Wilma at its peak, not a government channel.[1][4]
#10 (tie)
Typhoon Allyn — 884 hPa
Allyn is the oldest row and the least checked: its 884 hPa is the figure listed by Wikipedia from before the JMA’s 1951 best-track file, with no second source found. It struck Guam on November 17, 1949, passing within 35 miles of the island’s southern end with the strongest effects since 1900; there were no deaths, but hundreds of homes were destroyed.[1] No suitable video from an authoritative channel was found, so the icon is shown instead.
#10 (tie)
Cyclone Winston — 884 hPa
Winston is the strongest on record in the Southern Hemisphere: 884 hPa and 10-minute winds of 280 km/h (285 km/h over 1 minute) on February 20, 2016, as the Fiji Meteorological Service’s post-storm analysis has it; the JTWC gave 907 hPa. It struck Viti Levu, Fiji, at that strength, killing 44 and causing US$1.4 billion in damage. The video is NASA’s visualization of rain inside the storm.[1][6]
Wikipedia, List of the most intense tropical cyclones and each storm’s own article (Tip, Patricia, June, Nora, Ida, Kit, Rita, Vanessa, Wilma, Winston, Forrest, Megi, Joan, Marge, and the 1949, 1953 and 1971 seasons), read October 23, 2026. Pressures, winds, landfalls and death tolls come from these pages unless a later source below replaces them.
Japan Meteorological Agency (RSMC Tokyo), Best Track Data, 1951–2025: minimum pressures read from the file for every West Pacific row from 1951 on (Tip 870, Nora 875, June 875, Ida 877, Kit 880, Rita 880, Vanessa 880, Forrest 885, Megi 885, Nina 885, Joan 885, Irma 885, Marge 886; Nancy 890).
National Hurricane Center, tropical cyclone reports: Hurricane Patricia (EP202015) (872 hPa analysed; dropsonde 894 hPa).
Guinness World Records, Most intense tropical cyclone (Tip, 870 hPa, US Air Weather Service); Scientific American and AccuWeather, “Earth’s Strongest, Most Massive Storm Ever”, citing NOAA; Hurricane Science, “Typhoon Tip”.
2026 storms: Weathernews, Typhoon Champi bulletins (JMA 900 hPa, October 21); Wikipedia, 2026 Pacific typhoon season and Hurricane Polo (2026). The Champi value is an operational reading and may be revised.
Videos: NASA Video (Patricia), NASA Scientific Visualization Studio (Winston) and The Weather Network (Wilma) on YouTube; each ID was checked for channel and title. The others have no video from an authoritative channel. NASA, Inside Cyclone Winston.