Ranked by peak Oceanic Niño Index, the 2015–16 El Niño tops 16 events since 1950 at +2.8 °C, ahead of 1997–98 and 1982–83. Data are NOAA's ERSST.v5 ONI through AMJ 2026.
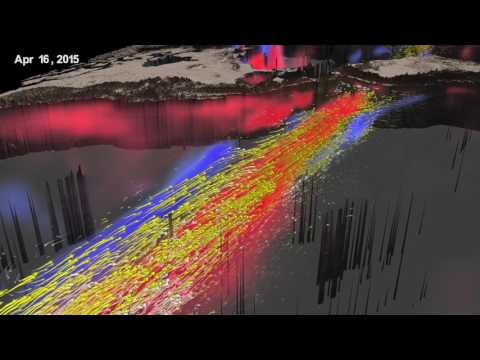
Pictured: NASA Goddard’s 3D visualization of the 2015–16 El Niño; this event is #1 with a peak ONI of +2.8 °C.
Rank
Event
Peak ONI (°C)
Peak season
Years above +0.5
Classification
Duration (months)
1
2015–16 El Niño
+2.8
NDJ
SON 2014 – AMJ 2016
Very strong
22
2
1997–98 El Niño
+2.4
OND–NDJ
AMJ 1997 – AMJ 1998
Very strong
15
3
1982–83 El Niño
+2.2
OND–DJF
MAM 1982 – MJJ 1983
Very strong
17
4
1972–73 El Niño
+2.1
OND–NDJ
AMJ 1972 – FMA 1973
Very strong
13
4
2023–24 El Niño
+2.1
NDJ
AMJ 2023 – AMJ 2024
Very strong
15
6
1965–66 El Niño
+2.0
SON–OND
AMJ 1965 – MAM 1966
Very strong
14
7
1957–58 El Niño
+1.8
DJF
MAM 1957 – JJA 1958
Strong
18
8
1986–88 El Niño
+1.7
JAS
ASO 1986 – JFM 1988
Strong
20
8
1991–92 El Niño
+1.7
DJF
AMJ 1991 – MJJ 1992
Strong
16
10
2009–10 El Niño
+1.6
NDJ
JJA 2009 – FMA 2010
Strong
11
11
1963–64 El Niño
+1.4
OND
MJJ 1963 – JFM 1964
Moderate
11
12
2002–03 El Niño
+1.3
OND
MJJ 2002 – JFM 2003
Moderate
11
13
1951–52 El Niño
+1.2
SON
MJJ 1951 – DJF 1952
Moderate
10
14
1968–69 El Niño
+1.1
DJF–JFM
SON 1968 – AMJ 1969
Moderate
10
14
1994–95 El Niño
+1.1
NDJ
ASO 1994 – FMA 1995
Moderate
9
16
2018–19 El Niño
+1.0
OND
ASO 2018 – MJJ 2019
Moderate
12
No matching rows.
Ranking rule: an event is a run of at least five consecutive overlapping three-month seasons with an Oceanic Niño Index (ONI) of +0.5 °C or more, counted from 1950 onward, the rule NOAA’s Climate Prediction Center uses for its historical table. ONI is the 3-month running mean of sea surface temperature anomalies in the Niño 3.4 region of the central Pacific; events are ranked by their single highest season, as published to one decimal place in the CPC ERSST.v5 table (table covers seasons through AMJ 2026; retrieved 16 October 2026). Events with the same peak share a rank (1972–73 and 2023–24 at +2.1; 1986–88 and 1991–92 at +1.7; 1968–69 and 1994–95 at +1.1), and a peak held for several seasons is shown as a range. Classification follows the common thresholds: very strong +2.0 or more, strong +1.5 to +1.9, moderate +1.0 to +1.4, weak below +1.0. Duration is the number of months from the start of the first qualifying season to the end of the last, so it is the season count plus two. The table lists the 16 events with a peak of +1.0 or more; weaker events are left out. Two big caveats: the ONI is recalculated as its baseline moves (the ERSST.v6 table gives 2015–16 a peak of +2.6, not +2.8), and the CPC now uses the Relative ONI (RONI) for official monitoring, which subtracts tropical-mean warming and puts 1982–83 first. On RONI the top three are 1982–83 at +2.4, 1997–98 and 2015–16 both at +2.3 (on ERSST.v6 they keep the v5 order at +2.6, +2.4 and +2.1), so the order among them depends on the index. A new El Niño is under way in 2026 (the ERSST.v5 table shows +1.0 in April–June 2026 and the v6 table +2.2 in July–September 2026); it has not finished and is not ranked.[1]
The Top 10
#1
2015–16 — +2.8 °C
The highest ONI of any event in the table: +2.8 °C in November–January 2015–16, and the longest run, 20 overlapping seasons above +0.5 (September–November 2014 to April–June 2016, 22 months), since the table treats the weak 2014–15 phase and the 2015–16 peak as one unbroken event. The video is NASA Goddard’s 3D visualization of the top 225 meters of the Pacific during this event, from its early-2015 onset to its April 2016 end.[2]
#2
1997–98 — +2.4 °C
Peaked at +2.4 °C in October–December and November–January 1997–98 and lasted 13 overlapping seasons. NASA’s Scientific Visualization Studio describes it as the strongest El Niño on record as seen in its satellite, ship and buoy observations, and Britannica’s account has its ONI peak, +2.3 °C in November–January, as the highest on record at the time. The video shows its subsurface ocean temperatures in 1997, not a summary of the whole event.[3]
#3
1982–83 — +2.2 °C
Reached +2.2 °C and held it for three overlapping seasons (October–December 1982 to December–February 1983), within a 15-season run. NASA’s Scientific Visualization Studio has an animation comparing its Pacific sea surface temperature anomaly with 1997–98, using NOAA satellite data, but no suitable official video of this event alone could be verified. Under the newer Relative ONI, NOAA reports, this event comes out on top.[4]
#4
1972–73 — +2.1 °C
Tied with 2023–24 at +2.1 °C (peak in October–December and November–January 1972–73), over 11 seasons. It overlapped the collapse of the Peruvian anchoveta fishery, whose catch fell from more than 12 million tons in 1970 to about 2 million in 1973; researchers cite overfishing as well as the El Niño, so the event is a contributor rather than the sole cause.[5]
#4
2023–24 — +2.1 °C
Tied for fourth at +2.1 °C in November–January 2023–24. NOAA declared El Niño conditions on June 8, 2023, after three years of La Niña, and the video shows the warm water appearing that June. The WMO described the event as among the five strongest on record, peaking in December 2023, but weaker than 1997–98 and 2015–16. It is the newest event in the table; on the Relative ONI it is far smaller (+1.4 °C).[6]
#6
1965–66 — +2.0 °C
The sixth event to reach +2.0 °C, peaking in September–November and October–December 1965 and fading by spring 1966 (12 seasons). The table is the only source used here for this event; no official video could be verified.[1]
#7
1957–58 — +1.8 °C
A slow event that peaked at +1.8 °C in December–February 1958 and stayed above +0.5 for 16 overlapping seasons (March–May 1957 to June–August 1958), the third-longest Top 10 run after 2015–16 and 1986–88. No official video of it could be verified.[1]
#8
1986–88 — +1.7 °C
The only multi-year event in the Top 10 besides 2015–16: 18 overlapping seasons from August–October 1986 to January–March 1988, with a +1.7 °C peak in July–September 1987. Tied with 1991–92 on peak. No official video of it could be verified.[1]
#8
1991–92 — +1.7 °C
Peaked at +1.7 °C in December–February 1992 after a slow start in spring 1991 (14 seasons). It is the last strong event before 1997–98. No official video of it could be verified.[1]
#10
2009–10 — +1.6 °C
The shortest Top 10 event, only nine seasons (June–August 2009 to February–April 2010), peaking at +1.6 °C in November–January 2009–10. The video is NASA’s overview of the 2009 El Niño and the La Niña that followed in 2010.[7]
NOAA Climate Prediction Center, “Oceanic Niño Index (ONI): Historical El Niño / La Niña episodes (1950–Present)”, ERSST.v5 table (cpc.ncep.noaa.gov), the source of every peak, season and duration; ERSST.v6 ONI table (cpc.ncep.noaa.gov) and Relative ONI table (cpc.ncep.noaa.gov) for the cross-checks; National Weather Service Public Information Statement 26-05 on adopting RONI. Durations were counted by RList from the published seasons.
NASA Scientific Visualization Studio, “A 3D Look at the 2015 El Niño” (svs.gsfc.nasa.gov); the video is on NASA Goddard’s YouTube channel.
NASA Scientific Visualization Studio, “The 1997-98 El Niño” (svs.gsfc.nasa.gov); video: “El Niño Subsurface Ocean Temperature in 1997”, NASA Video.
NASA Scientific Visualization Studio, “El Niño Sea Surface Temperature Anomaly Comparison: 1982/1983 to 1997/1998” (svs.gsfc.nasa.gov, NOAA AVHRR data); RONI ranking of 1982–83 as reported in Carbon Brief, “Super El Niño reaches remarkable all-time record” (carbonbrief.org), a secondary source.
Anchoveta catch figures: National Marine Fisheries Service, Fishery Bulletin 76(3), 1978, Quinn (fisherybulletin.nmfs.noaa.gov); overfishing context: SERC, Carleton College teaching resource on the 1972 anchovy collapse (serc.carleton.edu).
NOAA Climate.gov video, “Watch El Niño’s warm waters appear in the tropical Pacific in June 2023” (climate.gov); NOAA El Niño Advisory, 8 June 2023, as reported by WeatherZone; World Meteorological Organization, “El Niño weakens but impacts continue” (public.wmo.int).
NASA Climate Change (archived), “2009 El Niño and 2010 La Niña”, NASA video on YouTube.